Categories
How to Interpret Standard Deviation and Standard Error in Research
Standard Deviation 101 When it comes to aggregating market research, many of us are fairly familiar with mean, median, and mode. However, one lever deeper on the mean specifically brings…
Standard Deviation 101
When it comes to aggregating market research, many of us are fairly familiar with mean, median, and mode. However, one lever deeper on the mean specifically brings us to standard deviation and standard error. Standard deviation specifically offers a variety of insights when it comes to analysis; in business, a standard deviation might imply how risky a venture is. In manufacturing, the standard deviation might reference quality control. So, while standard deviation and standard error are not the most common variables, they’re instrumental in analyzing the confidence surrounding data and results.
What is standard deviation?
Standard deviation is a valuable research tool as it tells how spread out data is. Standard deviation is a value of how far each data point is from the mean, and it is also a descriptive statistic. Descriptive statistics, not surprisingly, describe the features of a data set. This includes values like distribution, mean, median, mode, and variability. Standard deviation helps summarize data, and a high standard deviation signals lots of variability in data. Standard deviations create the famous bell curves of data.
“Focusing on the central tendency in data and not considering its diversity can be disastrous. Unless the average is close to 0% or 100%, we can’t assume that the average represents everyone. In fact, it could represent no one. Does a mediocre rating mean that most people think your offering is mediocre, or do some think it’s great while others think it’s terrible? Can you build a business around just the ones who think it is great? Understanding the standard deviation and standard error helps you to identify opportunities you might otherwise overlook.”
– Nelson Whipple, GreenBook’s GRIT Research Director
Real-life applications of standard deviation
Standard deviation is not just a mathematical term used for research; it’s often used in everyday, real-life situations. From academic studies to business and finance to weather forecasting and medicine, standard deviation is a useful concept beyond the context of research.
Population traits
For example, if looking at population traits like height, weight, or IQ, standard deviation creates a bell curve of the data. If the mean IQ is 100, and the standard deviation equation gives us a value of 10, then we know that roughly ⅔ of the population has an IQ between 90 – 110. The remaining majority of the population would lie in more than one standard deviation of the mean, giving them an IQ of anywhere from 80 – 120.
Financial analysis
Another real-life application is in finance. When it comes to measuring the returns of different financial assets like stocks, bonds, commodities, and real estate, the standard deviation can illustrate how volatile or risky an investment might be.
For example, Stock A and Stock B might have the same annual rate of return of 7%; however, when looking at the standard deviation, Stock A is 2%, and Stock B is 7%. As Stock B has more data points that fall farther from the mean, an investor might receive wildly different returns year to year, making it a more volatile investment. On the other hand, stock A would most likely have an average rate of return that is close to 7% every year!
How to calculate standard deviation
It’s not simple to calculate standard deviation by hand as it uses an advanced equation: (image here). However, free online calculators like this one make it simple to plug in the values and quickly see a standard deviation number.
What is standard error?
Standard error is a value of multiple populations and sample sizes. When taking multiple samples, eventually, all data will be aggregated around a true population mean. The standard deviation of this distribution becomes your standard error. Standard error lets researchers know how accurate a sampling of the population is. For example, if you took the standard deviation of five different samples, you’d be able to see various samples that fell outside the norm. Maybe a sample was biased in some way or failed to hit the normal level of accuracy.
Standard deviation vs. standard error
What’s the difference between standard deviation and standard error? While closely related in survey and market research, standard deviation refers to variability within a single sample, while standard error clues researchers across multiple samples. Standard deviation gives you a closer look at an individual sample, while standard error is more useful for multiple sets of data.
“Would you rather know the average increase in property value in your neighborhood or the likelihood that your property’s value will increase by a certain amount? The mean tells you the former, and the standard deviation and standard error help you estimate the latter.”
– Nelson Whipple, GreenBook’s GRIT Research Director
How to calculate standard error
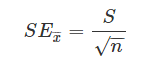
Similar to the standard deviation, the standard error is tough to calculate by hand, but it involves dividing the standard deviation by the sample size’s square root. Here is the formula, and here is a free online calculator.
When to use standard deviation and standard error
To determine confidence, volatility, and variability of data, standard deviation and standard error are both helpful tools in survey research and market research. To utilize them in your research, check out a free online calculator to quickly do the work for you.
Comments
Comments are moderated to ensure respect towards the author and to prevent spam or self-promotion. Your comment may be edited, rejected, or approved based on these criteria. By commenting, you accept these terms and take responsibility for your contributions.
Disclaimer
The views, opinions, data, and methodologies expressed above are those of the contributor(s) and do not necessarily reflect or represent the official policies, positions, or beliefs of Greenbook.
More from Karen Lynch
Tucker Mitchell on Curiosity, Consumer Connection, and Leading with Insight
Future List Honoree Tucker Mitchell shares perspectives on consumer insights, innovation, leadership, and balancing AI with human connection.
Your Next Competitor Might Be an AI Agent
AI is reshaping market research. Hear the latest product launches, funding, and trends transforming ...
ARTICLES
Top in Research Methodologies
Future Trends Emerging in Mixed-Method Marketing Research
Explore the future of mixed-method marketing research, including AI, synthetic data, continuous insights, and evolving research workflows.
Ashley Shedlock
Content Producer at Greenbook
When Easy Becomes Empty: The Frictionless Feedback Fallacy
Making surveys easier doesn’t always improve insights. Discover why thoughtful feedback design balances convenience with meaningful, reflective respon...
Tarik Covington
Founder & Chief Strategist at Covariate. Human-Centered Insights
The Always-on Agency: How to Survive the Shift to Intelligence-Native Organizations
The insight agency model is under pressure. In an always-on world, success depends on becoming a decision partner, not just a supplier of research pro...
Hannah Mann
Founding Partner at Day One Strategy
The Ambiguity of Frequent Survey Participation: Is “Hyperactivity” a Signal of Professional Fraud?
Learn how to identify engaged respondents, detect bad actors, and improve data quality for more reliable research outcomes.
Sebastian Berger
Head of Science ReDem at Rep Data

Sign Up for
Updates
Get content that matters, written by top insights industry experts, delivered right to your inbox.